User Tools
Sidebar
AMSAT-DL 2.4 GHz 6W PA
Measured values 20dB version
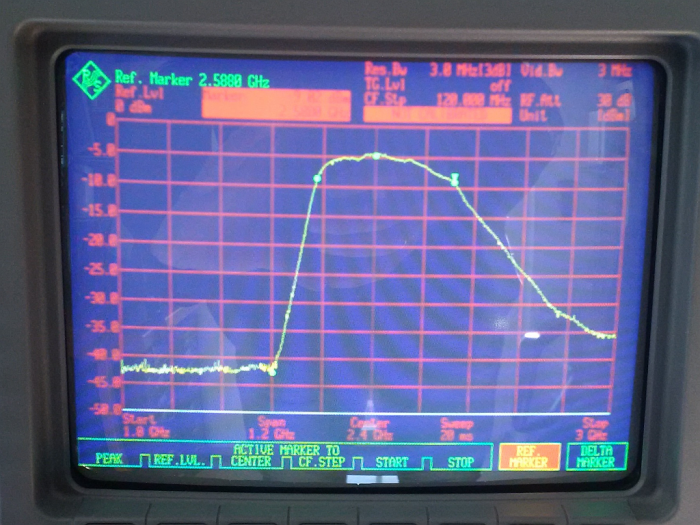
The first measurement of the frequency response of the amplifier was carried out in “Peak Hold” mode and the measuring transmitter was tuned by hand. The following picture shows the relative frequency response (attenuators were still inserted in the test setup). Absolute values follow later in this report.
The marker frequencies and levels are (from left to right):
M1: 2161 MHz -42.5dBm (actual value is lower, the result is limited by the dynamics of the measurement setup, later measurements show at least 60dB suppression)
M2: 2264 MHz -8.6dBm
M3: 2400 MHz -4.6dBm
M4: 2588 MHz -9.0 dBm
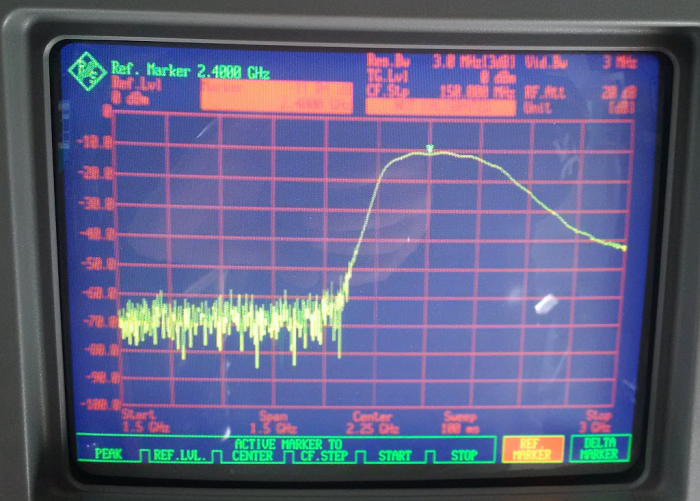
In a further measurement, the absolute gain of the amplifier was measured using the tracking generator built into the spectrum analyzer. The structure was first normalized, then the amplifier with a 30dB attenuator was added to the output. The level of the tracking generator was set to 0dBm.
Here are some roughly calculated gain values as a function of frequency:
| Frequency | Gain | Gain |
| uncorrected | corrected | |
| 1500 MHz | -70 dB | -40dB |
| 2000 MHz | -70 dB | -40 dB |
| 2100 MHz | -70 dB | -40 dB |
| 2200 MHz | -40 dB | -10 dB |
| 2300 MHz | -13 dB | + 17dB |
| 2400 MHz | -11 dB | +19 dB |
| 2500 MHz | -11.5dB | -18.5db |
| 2600 MHz | -15 dB | +15 dB |
| 3000 MHz | -43 dB | -13 dB |
As can be seen, the input filters work extremely well. With a transmission concept with a transmission IF of 435 MHz, the local oscillator is at 1965 MHz. A possible breakdown of the local oscillator in the transmitter is thus suppressed with at least 60dB.
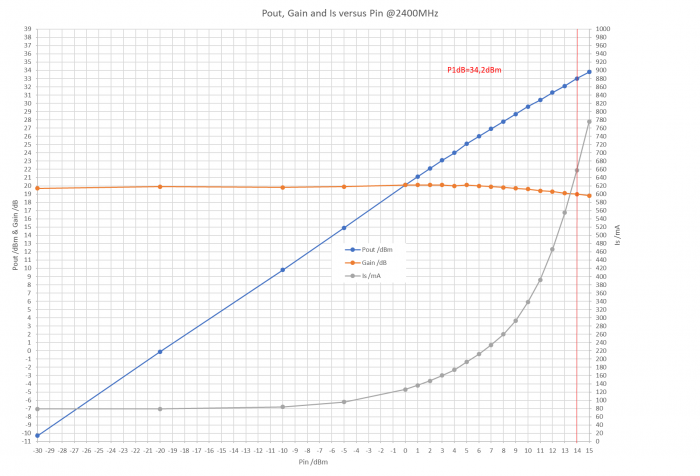
Here is a measurement of the output power and the gain of this 1st specimen as a function of the input power. Since the measuring transmitter delivers a maximum of + 15dBm, only the P1dB with 33dBm = 2W could be determined, but not the maximum output power.
The linear gain is 20dB. A drain efficiency of 26% was determined at an output power of 2.4W.


